Risk Breakdown Structure – A Risk Management Tool


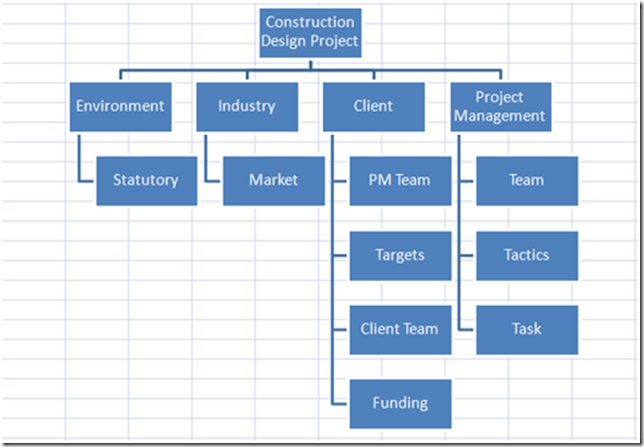
Risk Breakdown Structure (RBS) is defined as “A source-oriented grouping of project risks that organizes and defines the total risk exposure of the project. Each descending level represents an increasingly detailed definition of sources of risk to the project.” – David Hillson[1]

Instead of going through big spreadsheet with hundreds of verbose entries about risks, RBS provides – a pictorial representation of related items through tree structure as an excellent way of getting the whole picture in a single place for effective communication, management and governance.

image

Organizations have common list of risk categories or even template with sample risks for each category and type of project. This can be used as starting point for risk identification. Though RBS has lot of advantages – here are few:

* RBS give structured approach to risk identification through which all risk areas are explored without fail

* Grouping risks by common root causes can lead to developing effective risk responses

* RBS helps in risk assessment by interviewing or meetings with participants selected for their familiarity with a specific risk category

* RBS give greater ability monitor and control risks identified classified under the same area or root

References:

1. Use a Risk Breakdown Structure (RBS) to Understand Your Risks, David Hillson, Proceedings of the Project Management Institute Annual Seminars & Symposium October 3–10, 2002, San Antonio, Texas, USA. Retrieved from http://www.risk-doctor.com/pdf-files/rbs1002.pdf

Fishbone Diagram – A Project Management Tool


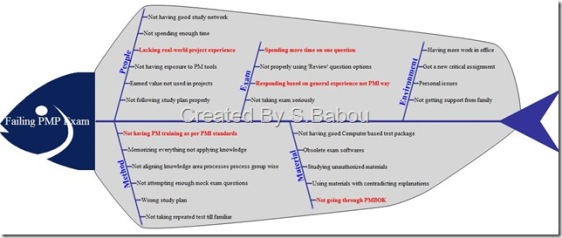
I thought of writing about this tool, but I found millions of web page result in my search engine! I decided to put a fishbone diagram with links to pages which I found useful to everyone of us.

Fishbone diagrams otherwise called as Ishikawa diagrams (or cause-and-effect diagrams) are diagrams that show the causes of a certain event. In project management, this tool is used in Quality Management & Risk Management processes. Here I depicted causes for ‘PMP Exam failure’ Effect.


PMP_FishBone

You can read more about this in following links:

1) Wikipedia – http://en.wikipedia.org/wiki/Ishikawa_diagram

2) Leankaizen – http://www.leankaizen.co.uk/fishbone-diagram-i-ishikawa-diagram.html

3) This one on 5 Why cause -effect analysis: Know the root cause for any problem within 5 whys

Expert Judgment – A Project Management Technique


Once I had a conversation with my team member. He just finished a complex customer issue.

I asked him “How are you feeling now?”

With a sigh he told “Uhh. Much relieved and relaxed.”

“Smart boy. You learnt my 3 year experience in a week time” I replied him with a proud smile.

I continued “You can gain more expertise on lot of things by working with me. What do you think about working with experts like me?”

He answered coolly “You can easily find out experts. Experts are the one who asks more questions and does not know the answers to those”.

*******

After reading the above – “Are you laughing at me?” 🙂 This is not the case in real life project management. Experts are asset to any activity esp. projects. Expert Judgment is a widely used Tools & Techniques in almost all major processes in PMBOK 4th edition from Initiating till Closing of project/phase (To be precise it is used as T&T for 19 processes). In some of the processes it is the one and only technique mentioned.

Experts are those individuals or group who possess specialized knowledge or training in particular area. In project management, experts are either part of the project (i.e. project manager) or involved (i.e. stakeholders) in project processes. Project teams with project manager and team members with relevant experience in the project related subject can perform the project with more success probability than those are not. Other than project team, generally available experts are project consultants, user groups, subject matter experts or senior management people.

Judgment provided by those people with expertise in appropriate project area is utilized at various stages of project phase in order to do effective project management. Their expertise is used to analyze historical information, define & ensure appropriate standards, get various suggestions/advice, evaluate different options, determine best suited options.

In order to get maximum utilization from Expert Judgment, as a project manager, you –

* Create a contact list & skill inventory for each stakeholders on the subject expertise

* Make sure you have adequate communication system in place to contact experts on time

* Ensure you seek expert judgment at appropriate time

* Use delphi technique whenever required. This helps you to reduce biased decisions

What is Critical Chain Method in Project Scheduling?


Creating realistic and accurate schedules is the first step towards project success. In Project Scheduling, PERT and Critical Path Method (CPM) are widely known methods. Using CPM, early Start and Finish dates and Late Start and Finish dates are calculated by forward & backward analysis of the project network diagram paths. But this method, does not take resource limitation into consideration. After identifying the path, resources are picked up & leveled. In general, activity owners add safety margin (buffers) to each of the activities in order to cope up with uncertainties. But this cause time waste when activities can be completed well before the estimated finish date.

Critical Chain Method, developed by Dr. Eliyahu M. Goldratt (1997), is a schedule network analysis technique that takes account of task dependencies, limited resource availability & buffers. First step in this method is identifying set of activities that results in longest path to project completion which are called critical chains. As it includes resources into consideration, it may be longer than CPM schedule. Resources used in those critical chain activities are critical resources. Set of activities that are in non-critical chain but converging to critical chain are feeders. Next step is shortening the project schedule by reducing the activity duration estimates with effective buffer management. CCM focuses on eliminating project schedule delays due to uncertainties, overestimation of task duration and wasted internal buffers.

In CPM, even a resource completes an activity before the planned finish date, the time gain is not propagated to next activity as he needs to wait till early start date of next activity. But delays are propagated which may even change the existing critical path. In the below example, I showed activity dependency & resource dependency across activities in a small project.

Any delay in Activity 1 (upper part of fig), will delay the entire project. Also if you see, the critical path is Activity 1 – Activity 3, though activity 2 is completed long before, Activity 3 has to wait till activity 1 is completed.

Critical_Chain_1

In the resource-leveled project(lower part of fig), same resource R1 used in two different activities A3 & A2. Though A1 is completed in 2 time units, but A2 has to wait till R1 finishes up A3 which 7 time units. Though A3-A4-Activity 3 is the critical path, but any delay in A3 or A2 will surely delay the entire project & due to Resource dependency another longest path comes into picture A3 – A2 – Activity 3 (15 time units). Hence, optimization of duration is required to concentrate not only on the activity dependencies but also on resource dependency.

Another important factor one need to deal in project scheduling is – safety margins(buffers) to beat the uncertainty. Due to addition of buffers at different activity level, it is very difficult to calculate exact time of project execution & this safety margin will go waste due to Student Syndrome or Parkinson’s Law.

In CCM, as calculation is based on set of activities in the critical chain, hence estimated finish dates for each activity is not of much use. Also, time gain or delay in an activity is fully passed throughout the chain activities. The internal buffers added to tasks are made explicit and summed up. The summed up value is called project buffer. As per CCPM, project buffer is part of project, hence project duration remain unchanged even after stripping off all the activity safety margins. And keeping them improves protection against uncertainties.

Also, 50% probability time estimates are used in calculating the activity durations in CCM instead of traditional 95% probability. Difference between original schedule estimates and new schedule estimates gives the project buffer. In general project scenario, there is 100% chance that activity-wise safety margin get exhausted by poor buffer management. In CCM, pooled project buffer is used as safeguard the entire project & even it is utilized up to 50% allows project completion well within the schedule.

Critical_Chain_2

CCM introduces 3 different buffers. 1. Resource buffer, 2. Feeding buffer, 3. Project buffer. Out of these, I discussed about project buffer previously. Let me give gist of other two buffers next.

Resource buffer

Resource buffer is inserted just before critical chain activity where ever a critical resource required. This is used to give a signal to the critical resource that a critical chain activity to which they are assigned is due to start shortly. According to CCPM, this wake-up call will cause the critical resource to wrap up any non-critical work and be ready to start work on the critical chain task as soon as its predecessors are completed. The resource buffer does not actually consume any resource, and it adds neither time nor cost to the project.[2]

Feeding buffer

Same like project buffer, pooling of activity safety margins in a non-critical chain & applying them at the end of those chain.Because this buffer is placed where the path feeds back into the critical chain path, it is called a feeding buffer. See the placement of feeding buffer in the fig.

References:

1.OVERVIEW OF CRITICAL CHAIN PROJECT MANAGEMENT by Francois Retief, Critical Chain Symposium 2002. http://www.hetproject.com/Francois_Retief_paper_Overview_of_Critical_Chain.pdf

2. A CRITICAL LOOK AT CRITICAL CHAIN PROJECT MANAGEMENT By Barnes, Robert, Publication: Project Management Journal, Date: Monday, December 1 2003 http://www.allbusiness.com/management/951030-1.html

3. 1. Critical Chain Project Scheduling By Kailash Awati & Arati Apte. http://www.orafusion.com/pm_cc.htm
4. Critical Chain Project Management Improves Project Performance by Larry P. Leach, Advanced Projects Institute, 1997. http://www.advanced-projects.com/CCPM/PMJOURN_R8.PDF
Why do we need to categorize risks?


Let me start with the definition of the word ‘category’

cat·e·go·ry(noun): any general or comprehensive division; a class.

group, grouping, type

The main goal of risk management is to avoid unpleasant surprises. This requires comprehensive list of identified risks. Risk categories are specific way to group risks under a common area which provides a structured & systematic approach in identifying risks to a consistent level of detail.

Some of the advantages using risk categories are:

* A good set of risk categories enable a greater management focus, thought provoking, and increasing the opportunity of identifying a wider range of risks

* As I told earlier, risk categories give structured approach to risk identification through which all risk areas are explored without fail

* Categorizing risks improve the effectiveness & quality of the risk identification & analysis processes

* Grouping risks by common root causes can lead to developing effective risk responses

* Risk categories also helps in risk assessment by interviewing or meetings with participants selected for their familiarity with a specific risk category

* Risk categories give greater ability monitor and control risks identified classified under the same area or root

It isn’t possible to develop one-size-fits-all risk categories for all projects/organizations. There could be common list of risk categories available which can be adapted with specific changes required for our projects. There are many ways to categorize risks. Generally, risks to the project can be categorized by

* sources of risk,

* the area of the project affected i.e. using Work Breakdown Structure(WBS), or

* other useful category like a project phase, to determine areas of the project most exposed to the effects of uncertainty.

Example for risk categories:

* Financial
* Security
* Legal & regulatory compliance
* Safety
* Stakeholder management
* Strategic
* Technology

As per PMBOK® Guide, risk categories are part of organizational process assets. Every organization should have standard lists of risk categories and it can be retrieved from achieves of already executed project.

To identify risks, project managers start with risk categories. But the process of identifying risks can also lead to identification of new risk categories. The newly identified category added to risk category list.

Risk categories can also represented in a structured way into a Risk Breakdown Structure (RBS). The RBS is a hierarchically organized depiction of the identified project risks arranged by risk category and subcategory that identifies the various areas and causes of potential risks.